Korto Cavitation Services


➔   Home   Introduction   Tests   Monitoring   Models   Information    Archive   Contact
➔   Plant_managers   Turbine_manufacturers   Monitoring_manufacturers


On-Site Vibro-Acoustical Diagnostic Tests


• Purpose of the test

- Assess turbine´s cavitation characteristics
- Reveal causes of cavitation

• How is the test performed?

Following the multidimensional method described in the Introduction, the sensors are fixed to the trunnions of all the guide vanes (illustrated below), and one sensor and a special server are fixed to the turbine shaft. The power for this server is supplied by the rechargeable batteries, and the data from it are transferred to the still space via a local wireless link. These data and the signals from the sensors on the guide vanes are fed to the basic server in the still space (see below its screen). A key phasor is used to synchronise the processing with turbine revolutions.
For the installation of the measurement equipment, half a day of a turbine standstill is necessary. The measurements last for a few hours or a few days, depending on the scope of the test program and availability of the operating points. For one head value, 20-30 load steps are necessary. Depending on the revolution frequency, the measurement on each stabilised step lasts for 5-10 minutes.
The resulting cavitation-intensity functions I(Ο), I(Ο,Θ), I(Ο,Θ,Φ), J(Ο) and J(Ο,Φ) (see in Introduction) are derived and saved. The analysis and interpretation of these data are performed off-line. The report with practical conclusions and recommendations is delivered after a few days or a few weeks, depending on a case.


• An illustration of the test results

As an example, the results of a diagnostic test performed on a 22-MW Kaplan turbine in a run-of-river plant (photograph above) are shown here. The turbine has 11+1 stay vanes, 24 guide vanes and 4 runner blades in a semi-spiral casing (drawing below).
The results:

(1) The two groups of cavitation mechanisms corresponding to the two erosion types found by the visual inspection in an overhaul - on the tips and the suction-side surfaces of all the runner blades (photograph) - are successfully recognized vibro-acoustically.

(2) The locations of these cavitation mechanisms with respect to the turbine parts are determined. The cavitation patches on the runner tips are caused by the tip passing behind the guide vanes; they are stationary in the still space and their locations are related to the respective guide vanes. The patches of the surface cavitation group are stationary in the rotating frame of reference; they are rotating with the respective runner blades.

(3) The simplest quantification of the cavitation intensity, through the global mean value, that is, at each operation point, by one value for each of the two groups of mechanisms and for their cumulative effect equal to the sum of the values for the two groups, I(Ο), is shown in the graph below.


(4) The consequences of the rotor-stator interaction found in the test are specified in the figure below. Here, the circumferential distribution of the mean local cavitation intensity, I(Ο,Θ), is drawn above the CFD prediction of the local pressure field in front of the runner (the amplitude of the tip curve is doubled). This result gives an insight into the causes of cavitation. Intake channel C causes no problems. The strongest tip cavitation occurs in channel B; weaker tip cavitation occurs behind all the guide vanes. Surface cavitation is caused by the flow disturbances stemming from the inflow through channel A.


(5) A full quantitative description of the mean role of the guide vanes in each of the two groups of mechanisms is derived (the graph on the left side below). The guide-vane intervals with high cavitation intensity are denoted by the arrows in this graph and by the guide-vane numbers in the figure above.


(6) The vibro-acoustic estimation of the average circumferential size of the erosion patches caused by each of the cavitation mechanisms in the two groups of mechanisms is presented as function of the load in the graph on the right side above. When the mechanisms are fully developed, the patches occupy up to a half of the distance between the neighbouring guide vanes. The amount of surface cavitation increases with the increasing load twice as fast as that of the tip cavitation.

• On the use of the test results

Optimisation of turbine operation - The data on the intensity of the two groups of cavitation mechanisms described in (3) can be used to minimise the effects caused by them. To do so one selects operation points in a way to avoid high intensities. Concerning the cavitation erosion, the best form of the result (3) is presented in the graph below. It was derived from the graph in (3) by applying the empirical rule for erosion caused by cavitation which says that the erosion rate is proportional to the k-th power of the cavitation intensity as defined here, where k = 2.46 ± 0.15 (see (16) in the paper).


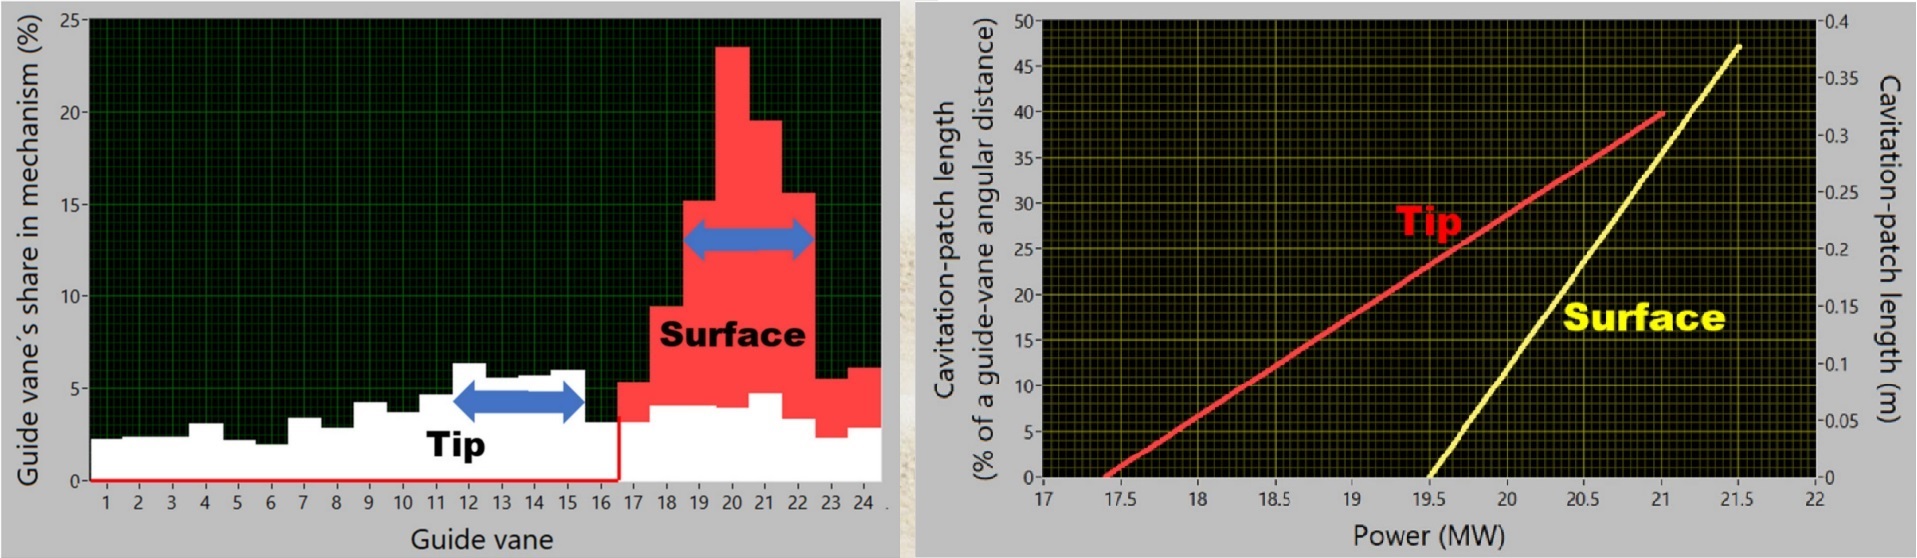
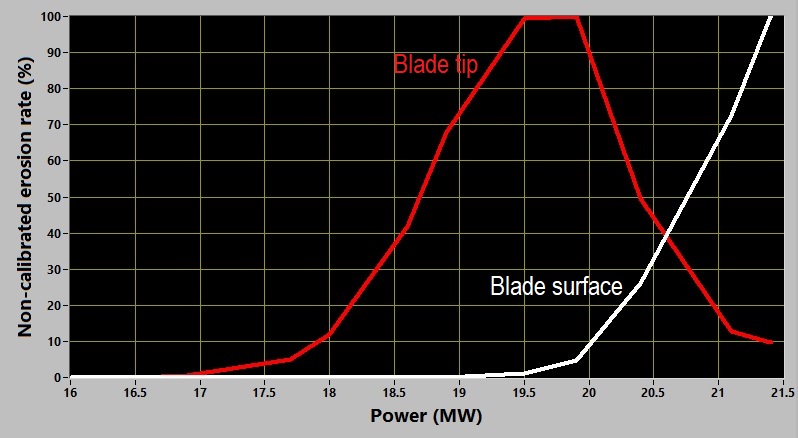
Depending on which type of cavitation is considered less acceptable, an operation point can be selected such which supresses it. This is illustrated in the graph below. In it, the percentage of the possible metal loss is shown for the case that the power is set at a specified value or above it - for the blade-tip cavitation, and at a specified value or lower than it - for the blade-surface cavitation. Setting the power at 19.8 MW eliminates the blade-surface cavitation and reduces the metal loss due to the blade-tip cavitation to a half of its full possible amount; setting the power at 21.1 MW does the opposite, it eliminates the blade-tip cavitation and reduces the blade-surface erosion to a half. A kind of an optimum is reached by operating the turbine at 20.4 MW. Then, both types of erosion are reduced below 20 % of their values which would result if driving the turbine equally often at the power values between 18 and 21.5 MW.
To minimise the total metal loss in a plant with two or more turbines, the test should be made on all turbines, and, in time intervals in which the full plant power is not required, distribute the load over the turbines appropriately.


Optimisation of turbine maintenance - To transform the test results into fully quantitative data on the erosion, an additional turbine-specific calibration of the erosion-rate data is needed. It can be accomplished by monitoring the cavitation intensities as in (3) or the respective assessments of cavitation erosion rate throughout the time between two checks of metal losses in the subsequent overhauls. This delivers a constant of proportionality in the erosion/load-rule which makes possible the erosion prediction based on a planed operation schedule and thus enables turbine-maintenance optimisation. Here is the logic:
Having, according to (3), the mean global cavitation intensity at the operation O, I(O), or its segments related the groups of cavitation mechanisms, and denoting by tn the total time the turbine spents on the operation point On - the data which can be derived from those in a common operation log - one calculates
[Constant of proportionality C] = [Metal loss found in the calibration time interval Tcalibration] ×{n tn [I(On)]k}-1, where ∑n tn = Tcalibration
and thus
[Metal loss expected in the passed or future time interval Toperation with a given set of tn and On] = C{n tn [I(On)]k}, ∑n tn = Toperation.

This is a simple tool for the analysis or prediction of the operation variants with respect to cavitation erosion. It uses data from an introductory cavitation test and the data on operation and thus does not require permanent cavitation monitoring.
Obviously, if the operation - passed, future or combined - follows the same program as in calibration, thus if the tn and On are identical, the forecasts are simple:

[Metal loss expected in Toperation] = [Metal loss found in Tcalibration] × Toperation / Tcalibration.

Turbine improvement - The other test results illustrated above, in addition to (3), deliver details of the cavitation mechanisms and can be used to improve turbine cavitation quality. Concerning this task, these diagnostic results are the final point that can be reached by the vibro-acoustic means. For defining the modifications that might result in an improvement of the turbine cavitation characteristics, model tests or a CFD analysis are necessary. The on-site vibro-acoustic test can then be used to check the result. Due to the scale effects in the model-to-prototype transformation of the cavitation results and the inaccuracy in machining, the results found on the prototype may differ from model predictions and can be considered more reliable.

➔   Top   Home   Introduction   Tests   Monitoring   Information   Archive   Contact
➔  
Plant_managers   Turbine_manufacturers   Monitoring_manufacturers